
1. Executive Summary
The comparative energy landscape of Northern Europe presents a striking economic dichotomy. Scotland and Norway, two nations separated by fewer than 400 miles of the North Sea, share remarkable similarities in their resource endowments. Both possess mountainous terrain ideal for renewable generation, low population densities in their northern territories, and an abundance of wind and hydrological resources that far exceed domestic demand. Yet, as of the first quarter of 2026, the electricity pricing reality for consumers in these two jurisdictions could not be more distinct. This report provides an exhaustive examination of the structural, economic, and policy mechanisms that drive the electricity price differential between Scotland and Norway. In January 2026, residential consumers in Northern Scotland face unit rates capped at approximately 28.36 pence per kilowatt-hour (kWh) with standing charges exceeding 62 pence per day [1]. Conversely, consumers in Northern Norway (Price Zone NO4) frequently encounter spot prices below 0.25 pence per kWh, with total costs—after grid rent and taxes—remaining a fraction of the Scottish equivalent [2]. The analysis identifies four primary pillars responsible for this divergence:
- Market Architecture: The fundamental incompatibility between the Great Britain (GB) "National Uniform Pricing" model, where gas sets the marginal price, and the Nordic "Zonal Pricing" model, where bottlenecks decouple regional markets.
- Generation Physics: The economic disparity between non-dispatchable wind generation (Scotland), which incurs high integration costs, and dispatchable reservoir hydropower (Norway), which offers inherent storage and flexibility.
- Grid Economics: The divergence in infrastructure funding, specifically the UK’s Transmission Network Use of System (TNUoS) charges which penalize northern generation, versus Norway’s localized Nettleie (grid rent) and congestion management strategies.
- Policy & Redistribution: The contrast between the UK’s history of levy-funded decarbonization and Norway’s state-ownership model which redistributes hydro-wealth via direct subsidies (Strømstøtte) and the emerging Norgespris fixed-price mechanisms.
2. Introduction: Two Energy Superpowers, One Sea, Two Realities
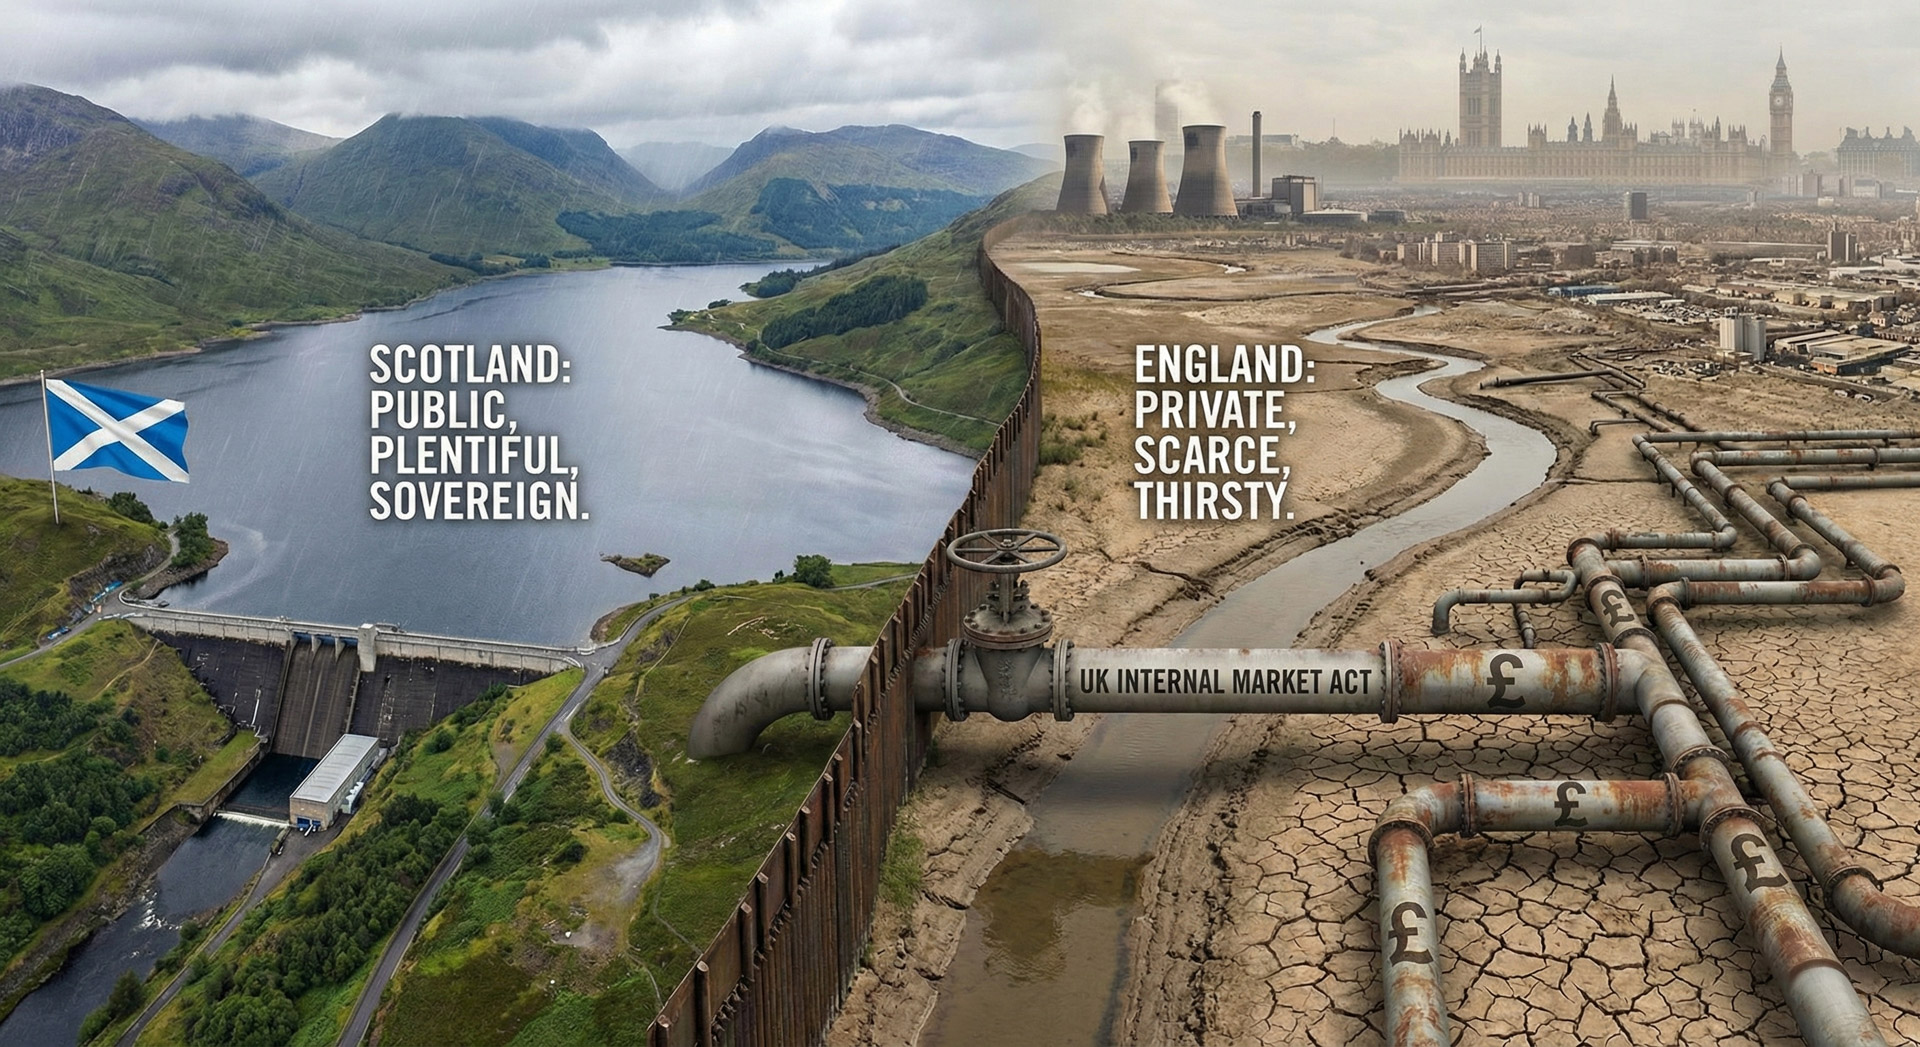
The energy crisis of the early 2020s fundamentally reshaped the European discourse on electricity pricing, exposing the vulnerabilities of interconnected markets and the disparate impacts of market design on national economies. As we advance into 2026, the dust has settled to reveal a persistent structural gap between the United Kingdom, specifically Scotland, and its Scandinavian neighbour, Norway. Scotland acts as the renewable powerhouse of the United Kingdom. With a population of roughly 5.5 million, it hosts over 15 GW of renewable capacity, frequently generating enough wind power to supply its domestic needs twice over [3]. It is a net exporter of green energy to England and, via interconnectors, to the continent. Yet, fuel poverty remains endemic, particularly in the Highlands and Islands, where the combination of cold climate, poor housing stock, and the highest standing charges in the UK creates a severe cost-of-living burden. Norway, with a similar population of 5.6 million, operates a power system that is 98% renewable, dominated by hydropower [4]. It is often referred to as "Europe's Green Battery." While Southern Norway (NO1, NO2, NO5) has experienced price contagion from continental Europe due to interconnection, Northern Norway (NO3, NO4) remains an energy oasis, shielded by grid bottlenecks that trap cheap hydropower within the region. The core question addressed in this report is why the physical abundance of low-carbon energy in Scotland does not translate into low consumer prices in the same way it does in Norway. The answer lies not in the cost of the turbines or dams, but in the "software" of the market—the regulatory frameworks, pricing algorithms, and political decisions that determine who pays for the transition to Net Zero.
2.1 Geographic and Resource Context
To understand the pricing mechanisms, one must first appreciate the physical grid topology. Both nations are characterized by a "North-South" divide.
- Scotland: Generation is heavily weighted towards the north (wind in the Highlands and offshore Moray Firth), while demand is concentrated in the Central Belt and, more significantly, in the south of England. The transmission network acts as a funnel, moving power south.
- Norway: Generation is distributed but with massive hydro reservoirs in the mountains of the west and north. Demand is concentrated in the south-east (Oslo) and along the coast. The grid is segmented by geography, creating distinct "price zones" that prevent a single national price from forming.
This geographical determinism sets the stage for the divergent market designs: the UK’s attempt to defy geography with a "postage stamp" national price for consumers (while penalizing generators locationally), versus Norway’s acceptance of geography through zonal pricing.
3. The Price Reality: A 2026 Comparative Data Analysis
The first step in diagnosing the divergence is establishing the precise cost differential faced by end-users in the first quarter of 2026. Data from Ofgem, the Norwegian Water Resources and Energy Directorate (NVE), and Statistics Norway (SSB) provide a granular view of the disparity.
3.1 Residential Electricity Costs in Scotland (Q1 2026)
In Scotland, the price of electricity is largely defined by the Ofgem Price Cap, which sets a maximum rate for standard variable tariffs. As of January 1, 2026, the cap rose due to seasonal demand and wholesale market fluctuations.
Unit Rates and Regional Variance
While the "headline" price cap figure is often cited as a national average (approx. 27.69p/kWh), the reality for Scottish consumers is regionally specific. The UK is divided into 14 Distribution Network Operator (DNO) regions, with Scotland split into "Northern Scotland" (SHEPD area) and "Southern Scotland" (SP Distribution area). The data for January–March 2026 reveals the following tariff structures:
| Region | Unit Rate (p/kWh) | Standing Charge (p/day) | Annual Cost (Typical 2,700 kWh) |
|---|---|---|---|
| Northern Scotland | 28.36 [1] | 62.07 [1] | ~£992 |
| Southern Scotland | 27.18 [1] | 57.62 [1] | ~£944 |
| UK Average | 27.69 [5] | 54.75 [5] | ~£947 |
The Burden of Standing Charges: The standing charge in Northern Scotland is a critical point of contention. At 62.07 pence per day, a household pays approximately £226 per year for grid connection alone, regardless of usage. This is significantly higher than the UK average and reflects the high cost of maintaining distribution networks in varied terrain with low customer density. Although the "Hydro Benefit Replacement Scheme" provides a subsidy to lower these distribution costs, the region remains the most expensive in the UK for fixed charges [6].
Composition of the Scottish Bill
The high unit rate in Scotland is driven by the components stacked within it:
- Wholesale Cost: Determined by the marginal price of gas (discussed in Section 4).
- Network Costs: Transmission and distribution charges.
- Policy Costs: Levies for schemes like the Renewables Obligation (RO).
- Taxes: VAT at 5%.
Despite the UK Government’s Budget 2025 announcement to move some green levies to general taxation (saving ~£150/year from April 2026), the January 2026 prices still reflect a system where policy costs constitute roughly 16% of the bill [7].
3.2 Residential Electricity Costs in Norway (Q1 2026)
Norway’s pricing structure is tripartite: the Spot Price (Kraftpris), the Grid Rent (Nettleie), and Taxes (Avgifter). Crucially, the spot price component is not national; it is zonal.
Zonal Spot Prices
Norway is part of the Nord Pool exchange and is divided into five bidding zones:
- NO1 (East/Oslo), NO2 (South), NO5 (West): These zones are hydro-rich but interconnected with the UK, Germany, and Denmark. Prices here are influenced by continental gas and carbon prices.
- NO3 (Central), NO4 (North): These zones have a massive surplus of generation and limited export capacity. Prices here are determined by local hydrological balance.
In late 2025/early 2026, the spot price divergence was extreme. While Southern Norway averaged 4.5–6.1 pence per kWh, Northern Norway (NO4) saw prices frequently drop below 0.38 pence per kWh [2].
The "Strømstøtte" Subsidy Mechanism
To mitigate the high prices in the South, the Norwegian state implements a subsidy scheme (Strømstøtte). For 2026, the government covers 90% of the spot price exceeding 5.55 pence per kWh [8]. This effectively caps the commodity cost for consumers in NO1/NO2/NO5. Consumers in NO3/NO4 rarely trigger the subsidy because their market prices are naturally below the threshold.
Grid Rent (Nettleie) and Taxes
Norwegian grid rent uses a "Capacity Subscription" model (Fastledd) introduced to encourage load shifting. A household keeping peak usage under 5 kW pays approx. 135–215 NOK/month (£10–15). From January 1, 2026, the electricity tax (Elavgift) is 7.13 øre/kWh (approx. 0.5p) [9].
3.3 The Comparative Gulf
Aggregating these components highlights the massive disparity.
- Scotland (Highlands): A consumer pays ~28p/kWh.
- Norway (Tromsø - NO4):
- Spot Price: ~3.5 øre (0.25p)
- Grid Energy Link: ~30 øre (2.1p)
- Tax: ~7.13 øre (0.5p)
- Total Variable Cost: ~40.6 øre (~2.9 pence/kWh)
Even when accounting for fixed charges, the Scottish consumer pays roughly 7 to 9 times more per unit of energy than their counterpart in Northern Norway.
4. Market Architecture: The Structural Origins of Price
The chasm in pricing is not merely a reflection of resource availability but a direct consequence of market design. Scotland operates within a National Uniform Pricing system (Pay-as-Clear), while Norway operates within a Zonal Pricing system.
4.1 The Great Britain Model: Marginal Pricing and the Gas Trap
Scotland is part of the single GB bidding zone. This means that for any given half-hour settlement period, there is one wholesale price for electricity across the entire island of Great Britain, regardless of where the power is generated or consumed.
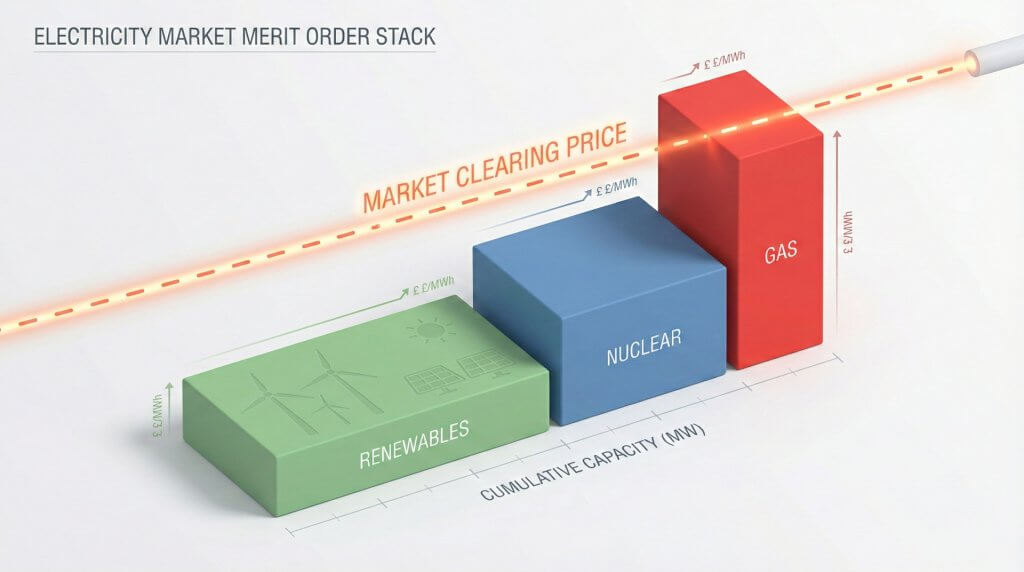
The Merit Order and Marginal Pricing
The GB market operates on a "Merit Order" stack. Renewables (Wind/Solar) bid into the market at very low prices. However, the market clears at the price of the last generator required to meet demand. Because demand in the south of England is high and renewable generation is intermittent, gas-fired power stations are required to "close the gap" in the majority of settlement periods (approx. 84% of the time).
The "Cannibalization" of Scottish Wind
This mechanism creates a paradox for Scotland. Ideally, on a windy day, Scotland generates 100% of its electricity needs from wind (marginal cost: zero). However, because Scotland is part of the GB market, the price is not set by Scottish wind, but by the gas plant in Kent or Yorkshire that is turning on to feed London. Scottish consumers pay a gas-pegged price for zero-carbon electricity [10].
4.2 The Nordic Model: Zonal Pricing and Decoupling
Norway creates prices based on physical reality. The country is split into bidding zones (NO1–NO5). Prices are determined by the intersection of supply and demand within each zone. Surplus Zones (NO4 - North): The north has a massive surplus of hydro generation. The transmission lines connecting NO4 to the south are limited (bottlenecks). When hydro reservoirs are full, producers must generate to avoid spilling water. They bid aggressively low. Because the "export pipe" is full, the local price crashes to the marginal cost of hydro (near zero) [2]. Why This Matters: Zonal pricing allows Northern Norway to enjoy the fruits of its "stranded" renewable assets. In contrast, the UK’s single price sends no such signal to consumers; a factory in the Highlands pays the same wholesale price as a factory in London.
5. Generation Dynamics: The Volatility of Wind vs. The Flexibility of Hydro
5.1 Scotland: The Challenge of Intermittency
Scotland’s renewable portfolio is heavily skewed toward wind [3]. While the Levelized Cost of Electricity (LCOE) for wind has fallen, wind cannot be dispatched on demand. When the wind blows hard across the North Sea, all wind farms generate simultaneously. In the GB market, this suppresses the price somewhat, but if gas is still needed for stability in the south, the price remains high. Crucially, Scotland lacks sufficient long-duration storage to "bank" this wind.
5.2 Norway: The "Green Battery" Advantage
Norway’s power system is built on reservoir hydro.
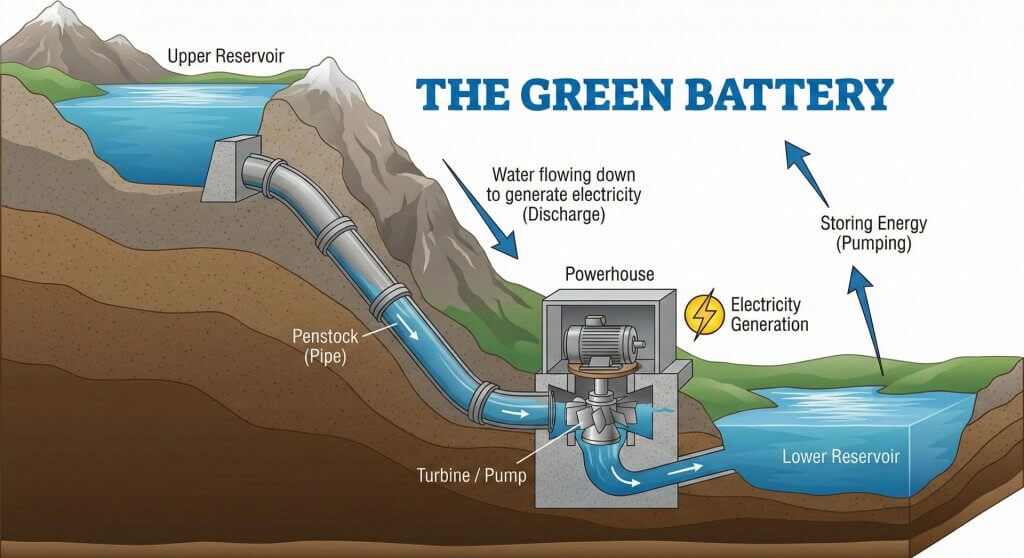
- Storage Capability: Norway has ~87 TWh of multi-year reservoir storage.
- Water Value (Vannverdi): Producers calculate the "opportunity cost" of water, deciding whether to generate now or save for winter.
- LCOE Comparison: Norwegian hydro plants are largely amortized with negligible operating costs ($1–2/MWh). New wind in Scotland, while cheap, still incurs higher financing and integration costs [11].
6. The Grid Toll: Transmission Charging & Locational Signals
Perhaps the most contentious element of the Scottish electricity bill is the Transmission Network Use of System (TNUoS) charge.
6.1 The UK’s TNUoS Methodology
The UK uses "Investment Cost Related Pricing" (ICRP) to reflect the cost of transporting electricity. Since demand is in the South and generation is in the North, Scottish generators are deemed to cause higher transmission costs. Generators in Northern Scotland pay the highest TNUoS charges in Europe [12]. Forecasts for 2026/27 indicate a significant rise in these tariffs to fund the "supergrid" needed to export Scottish wind [13].
6.2 Norway’s Grid Rent (Nettleie)
Norway funds its grid through Nettleie, paid almost entirely by consumers, not generators. Norwegian generators pay a very low "feed-in" tariff. This ensures that the location of generation is driven by where the water/wind is, rather than grid charges. The Norwegian system accepts that generators build where the resource is, and uses price signals to tell consumers when to use power [14].
7. The Cost of Constraints: The Scottish Paradox
7.1 The B6 Bottleneck
The transmission boundary between Scotland and England (B6) acts as a pinch point. The capacity to export power south is currently roughly 6 GW, while Scottish renewable capacity exceeds 15 GW.
7.2 The Financial Impact (BSUoS)
When Scottish wind exceeds export capacity, the National Energy System Operator (NESO) must pay wind farms to turn off ("Constraint Payments") and pay gas plants in the south to turn on. These costs are aggregated into the Balancing Services Use of System (BSUoS) charge. In 2024/25, these costs spiraled to over £1 billion [15]. Approximately 8.3 TWh of wind energy was curtailed in the UK in 2024—the vast majority in Scotland [16].
7.3 Norway’s Solution: Zonal Splitting
Norway deals with bottlenecks differently. Instead of paying generators to turn off, the zonal price simply separates. Prices in the North drop to zero, and generators turn off voluntarily. The cost of the bottleneck is borne by the generator (lost revenue), not the consumer (constraint payment).
8. Interconnection & Contagion: The North Sea Link Effect
The 1,400 MW North Sea Link (NSL) connecting Blyth, UK to Kvilldal, Norway has altered pricing dynamics.
8.1 Price Contagion in Southern Norway
Before the NSL, Norwegian prices were insulated. Now, hydro producers in Southern Norway (NO2) have access to the UK market. If the UK price is high, Norwegian producers will not sell domestically for less. This "opportunity cost" adjustment imported the energy crisis into Southern Norway [17].
8.2 The UK Perspective
For the UK, the NSL provides security. When the wind doesn't blow in Scotland, the UK imports Norwegian hydro. However, because the UK market is so large, the impact on the average consumer bill is diluted, whereas the impact on the smaller Norwegian market was a massive price shock.
9. The Policy Layer: Levies, Taxes, and State Support
9.1 The UK: The Legacy of Levy Funding
The UK has historically funded decarbonization through levies on electricity bills (e.g., Renewables Obligation). This essentially taxes a necessity. The Labour Government’s 2025 Budget addressed this, shifting some costs to general taxation from April 2026 [18].
9.2 Norway: The State as Owner and Distributor
Norway’s model relies on state ownership. ~90% of hydropower is public. When prices spike, state revenue skyrockets via the Resource Rent Tax. The Strømstøtte returns this windfall to the consumer. Additionally, proposals for a "Norway Price" (Norgespris) aim to further de-commoditize electricity for essential use [19].
10. Industrial Competitiveness
Scotland: The Scotch Whisky industry faces a "double whammy" of high unit rates and high transmission charges [20]. The UK government’s "British Industry Supercharger" scheme (2026) aims to exempt Energy Intensive Industries from many of these costs [21]. Norway: Northern Norway has attracted data centers and battery factories due to rock-bottom spot prices. However, low reservoir levels have led to calls for export restrictions to protect industrial security [22].
11. Future Horizons: Market Reform and Long-term Contracts
As 2026 progresses, both nations are actively redesigning their energy markets to address these structural flaws. The UK’s Review of Electricity Market Arrangements (REMA) proposes moving to zonal pricing [23], which would lower wholesale prices in Scotland but potentially risk "cannibalizing" generator revenue. Norway, meanwhile, is moving toward standardized fixed-price contracts to stabilize household costs.
12. Conclusion
The electricity price chasm between Scotland and Norway in 2026 is a testament to the power of market design. Norway’s system—built on zonal pricing, state ownership, and dispatchable hydro—allows it to capture and redistribute the value of its energy locally. Scotland, conversely, is trapped in a "transitional paradox," generating 21st-century wind power within a 20th-century market structure designed for fossil fuels. For Scotland to achieve "Norwegian-style" prices, it requires a fundamental decoupling of green electrons from gas prices and a restructuring of grid charges. Until then, the windiest country in Europe will continue to look enviously across the North Sea at the battery that never goes flat.
The comparison between Scotland and Norway reveals more than a divergence in electricity pricing models; it exposes the structural limits of Scotland’s current constitutional position. Norway’s ability to design a market that reflects its geography, harnesses its natural resources, and redistributes energy wealth to its citizens is not an accident of geology but a consequence of sovereignty. Its zonal pricing, state ownership of hydropower, and targeted subsidy mechanisms are all policy choices made possible by full control over energy regulation, taxation, and infrastructure planning.
Scotland, despite possessing comparable renewable abundance, operates within a framework where these levers are held elsewhere. The GB-wide marginal pricing system, the uniform consumer tariff, the TNUoS methodology, and the interconnector strategy are all determined at a UK level. As a result, Scotland’s energy system is optimised not for Scottish conditions but for the needs of a larger, gas‑dependent market centred hundreds of miles to the south. The outcome is a paradox in which one of Europe’s most energy‑rich regions pays among its highest retail prices.
If Scotland seeks to replicate the Norwegian model — with locally reflective pricing, strategic use of surplus generation, and the ability to reinvest energy wealth directly into households and industry — it requires the same policy autonomy that Norway exercises. Market reform within the UK may narrow the gap, but it cannot replicate the structural advantages of a sovereign energy system. The evidence presented in this report therefore suggests that the question of electricity pricing is inseparable from the question of constitutional choice. The North Sea divide is not only a matter of market design; it is a matter of governance.
Works Cited
- Energy prices by region in 2026 - Uswitch. Read Source ↩
- Slightly higher electricity price in third quarter – SSB. Read Source ↩
- Renewable Energy Facts & Statistics, Scottish Renewables. Read Source ↩
- Norway - Ember. Read Source ↩
- Changes to energy price cap, Home Energy Scotland. Read Source ↩
- Third Party Costs Explained: TNUoS, Drax. Read Source ↩
- Gas and electricity prices during the 'energy crisis' - House of Commons Library. Read Source ↩
- Response to complaint concerning Norway Price for electricity - regjeringen.no. Read Source ↩
- Avgift på elektrisk kraft - Skatteetaten. Read Source ↩
- How is the electricity price calculated? | Nord Pool. Read Source ↩
- Renewable Power Generation Costs in 2024 - IRENA. Read Source ↩
- TNUoS Charges | Zones, Bandings & Calculations Explained - Business Energy Deals. Read Source ↩
- Five-Year View of TNUoS Tariffs for 2026/27 – 2030/31, NESO. Read Source ↩
- RME Ekstern rapport nr. 3/2025 - NVE. Read Source ↩
- Scottish Grid Balancing Costs Soar to Record £1 billion - NIA UK. Read Source ↩
- Discarded wind energy increases by 91% in 2024 - REF. Read Source ↩
- Norway's Power Supply to Europe Threatened by Low Hydro - Energy Connects. Read Source ↩
- What does the Budget mean for energy bills? | Nesta. Read Source ↩
- “Norway Price” for Electricity and District Heating - regjeringen.no. Read Source ↩
- Whisky Loch 2025? Is the Whisky Industry Heading for a Crisis? - The Whiskey Wash. Read Source ↩
- British Businesses to Save over £400m a Year - Gov.uk. Read Source ↩
- Norway turning away from electricity interconnection - Watt-Logic. Read Source ↩
- GB wholesale electricity market reform: impacts for Scotland | ClimateXChange. Read Source ↩